

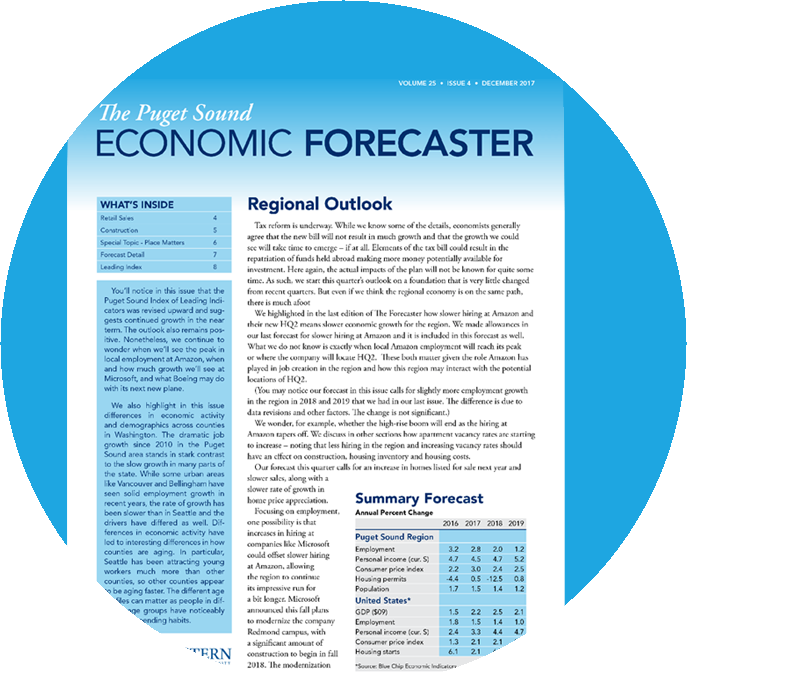
Economic forecasts,
for the greater Seattle area.
Consider us your research center, providing you answers in easy to understand language and charts.
Established in 1993, The Puget Sound Economic Forecaster is a quarterly report published by the Center for Economic and Business Research at Western Washington University which acquired the publication in 2017 from its founders, Conway Pedersen Economics, Inc.
The report and website are designed for business executives, marketing directors, investors, government managers, and researchers who need a professional and objective view on the economic prospects for the Puget Sound region (King County, Kitsap County, Pierce County, and Snohomish County).
Our goal is to provide accurate and well-reasoned forecasts for the region as well as clear and insightful observations on important developments in the economy.
In-Depth Regional Economic Outlook
The first issue of the
Puget Sound Economic Forecaster,
a quarterly report,
was published in December 1993.
Each report contains a summary forecast, in-depth discussion of the regional outlook, forecasts and analyses of retail sales and construction and real estate, a special topic (e.g., China and Population Change), a detailed forecast table, and the Puget Sound Index of Leading Economic Indicators.
To facilitate research and analysis on the regional economy, every issue of the regional economic report is archived as a downloadable PDF file in the Subscriber Area. A comprehensive Subject Index of the archived reports has been developed to aid in the retrieval of information.
Reports are posted to the web site one to two weeks before the printed copy is mailed.
Sample Report – Data, Trade and Trends [Volume 27, Number 2, June 2019]
With thoughts of the long warm days of summer on our minds, we have found ourselves interrupted pondering about the price of avocados and how the latest round of tariff threats that may impact retail sales and the general economy overall. Thoughts of spending time at the lake or river have found us considering stream flows and how the change in our climate may impact all of the people and businesses that rely on water in one way or another. Daydreams of patio and deck BBQs have caused us to reflect on changes in house prices and the sudden growth in sales outside of the King County – is it more commuters or are jobs moving? Will the Seattle to Everett corridor retain its worst traffic in the nation ranking? Evidently, economists are bad at not thinking about things. All of the above is ahead in this edition of the Forecaster plus a better understanding of workforce participation and the state forecast. We will just call it the beach edition.
Additional Features
In addition to the Quarterly Report,
we regularly publish
Additional Feature Reports
Breaking News
What We Are Following in the News

Almost half of US millennials say their financial situation has improved from five years ago, according to a survey published Tuesday by Chime. That compares with 43% of Generation X and 40% of baby boomers who say the same. Now between age 29 and 45, many millennials entered the job market during the Great Recession, saddled with historically high student debt. As they slogged through adulthood, they failed to reach financial milestones others had attained by the time they hit 40. Yet while millennials still trail older generations in accumulated wealth, they’ve been catching up, Federal Reserve data show. Since the beginning of 2021, millennials’ net worth has jumped 134% to $19.12 trillion, versus 32% for boomers (those born between 1946 and 1964). https://www.bloomberg.com/news/articles/2026-08-18/millennials-feel-better-about-their-finances-than-generation-x-baby-boomers?cmpid=eveus&utm_campaign=eveus&utm_medium=email&utm_source=newsletter&utm_term=260818&utm_c
As once-frenetic population growth has slowed to a trickle in Seattle and Bellevue, the fastest-growing sites in our region are places many Seattleites might not be able to find on a map. Thanks to the “Donut Effect,” one Southeast King County community has grown by 61% since 2020. https://www.seattletimes.com/seattle-news/data/while-seattle-slows-the-regions-fastest-growth-is-on-the-fringes/?utm_source=marketingcloud&utm_medium=email&utm_campaign=Morning+Brief+08-18-26_8_18_2026&utm_term=Active%20subscriber
Germany’s businesses these days aren’t just contending with amped-up Chinese competition and elevated energy costs. They’ve also got a major demographic challenge on their hands, according to figures compiled by ZEW Institute and Creditreform, a creditors’ protection association. Almost 190,000 firms ceased operations in 2025, up about 10% from the previous year and the second significant annual increase in a row, the findings show. Only every eighth case was down to insolvency, with more and more firms shuttering due to reasons including skilled-worker shortages, high costs and a lack of people willing to take over.
Donald Trump says deal reached with Canada and pauses tariffs. Last-minute reprieve follows ‘intense’ talks with Mark Carney to avert 50% levies on billions of dollars in goods. https://www.ft.com/content/8a256a34-5e8d-459a-80a3-78ba6aa121af?desktop=true&segmentId=7c8f09b9-9b61-4fbb-9430-9208a9e233c8&syn-25a6b1a6=1#myft:notification:daily-email:content
Multifamily permitting increased nationally in the first half of 2026, but the headline growth masked a widening divide in the apartment development pipeline. While permits rose 4.5% year over year, several of the country's largest multifamily markets recorded significant declines. According to the National Association of Home Builders, the gains are increasingly occurring in smaller markets and among smaller builders. https://www.globest.com/2026/08/18/smaller-multifamily-markets-drove-permit-growth-as-large-metros-diverged?utm_source=email&utm_medium=enl&utm_campaign=nationalalert&utm_c
Long-term borrowing costs across major economies hit multi-decade highs on Tuesday as inflation concerns, deficit fears and surging AI bond issuance put pressure on government debt around the world. https://www.ft.com/content/61354e68-c4ba-4716-b849-b332608c8c65?utm_medium=email&utm_source=exponea&xnpe_cmp=.eJwTUnilUZdTEvH1tufRhA2LggVX-1xe1BNQMZP399Guwu0HqvMNFWalJwotvOUYVaqvn5SfUqlfkpiUk6pfAmEX6ZekQESiLWMxBZFFoo1jYYJIukxjodyUzDIwLtAvLkjM0y8uKcrPS9dPzOJJWHy0m8Eku1zif-_2BiYmABgGRqY.gKdP8dC_JQPMFw&xnpe_tifc=OIH84fhLhfPNh.YjOI_8xjpJVdUZMds_OuHZhF1jbIEstIod4.oA4FYpbCJNxuHXtILuOI_jh.b7OFn8h9XlbIeubdop4IBNxkh.hF1j&syn-25a6b1a6=1
Questions? We Love Questions!
We receive a wide-range of questions every day and would love to hear yours. Questions lead to data and data should lead to better questions.
Special Topics
Special topics in each report
intended to increase the
reader’s understanding of
how the Puget Sound economy works
Past topics include regional growth, labor productivity, demographic trends, inflation, multipliers, entrepreneurs, and state and local taxes.
Web site subscribers currently have access to more than fifty special topics. Here are four examples drawn from the Special Topic Archive:
Stream Flow [Volume 27, Number 2, June 2019]
Is Traffic Real? [Volume 27, Number 1, March 2019]
Labor Force and Population [Volume 26, Number 4, December 2018]
Forest Fires [Volume 26, Number 3, September 2018]
Subscribe To Our Report
and Get Ahead of the Curve
Need More Info? Contact Us with Your Questions
Join Current Subscribers Like